Diagrams
Once you have created or opened a threat model file the next step is to edit the threat model diagrams.
Click on the diagram to be edited on the threat model main page to be taken to the diagram editor.
Processes, data stores and actors
Add model elements to your diagram by dragging a component from the stencil on the left side of the diagram editor. Once added they can be selected by clicking them to see their properties and threats and dragged around the diagram.
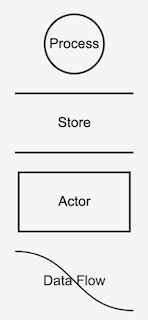
The diagram elements are by convention identified by their shape:
- A process, usually within the control of the application, is denoted by a circle
- A data store by two parallel lines
- An actor, usually external to the application, denoted by a rectangular box
- Arrows denote data flows between diagram components
These are conventions that do not have to be followed, but it is probably best to keep to this convention. For example if processes are denoted using a rectangular ‘Actor’ box then the threat generation by element can become restrictive, but it is still possible to add any type of threat to any component using a diagram type of ‘Generic’.
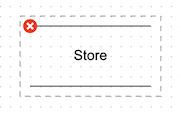
To delete an element, first select it and then click on the red icon in the element’s top left corner:
These components can be resized and can be dragged to change the aspect ratio. Multiple components can be selected using a mouse control-click or by dragging a selection box.
Data flows and trust boundaries
Data flows and trust boundaries can be added to the diagram by clicking their shape in the stencil on the left side of the diagram editor. Trust boundaries can be in the form of a box or a curve.
A data flow or a trust boundary can be selected by double clicking, or by clicking on the end arrows. Once selected you can edit its properties and add threats to it.
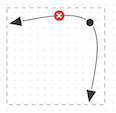
Data flows and trust boundaries can be deleted by clicking the red icon that appears after it has been selected.
The data flow defaults to unidirectional and can be changed to bidirectional by editing the properties. To connect the end of a data flow to a diagram element drag one of its ends onto the element.
Extra vertices can be added by clicking at some point on the line. These new vertices can also be dragged to position the data flow or trust boundary. Drag an existing vertex onto another to remove it.
Selecting data flows and trust boundary curves
The data flow and trust boundary curve elements are not not easy to select once they are placed on the diagram. This is fairly consistent across diagram packages, the nodes are easy to select and move but the arrows not so much.
Selection of the data flow and trust boundary curve elements is done by either:
- Hover over an end of the curve and click on an arrow head
- If the element label is present then clicking on that will select the element
Once selected the dataflow or trust boundary curve will be highlighted, similar to other diagram elements.
Element properties
To edit the properties of a model element, first select it. The element properties will then be shown on the lower left side of the diagram editor.
The properties vary according to the diagram element type.
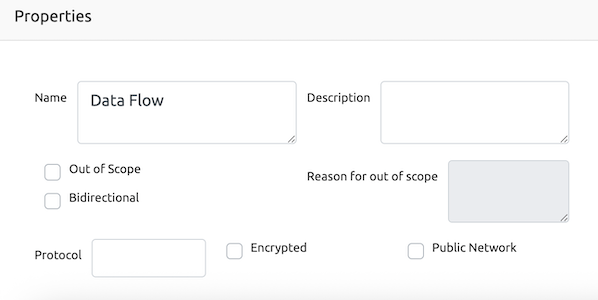
For example the data flow has properties :
- Name
- Description
- Out of Scope
- Protocol
- Reason for out of scope
- Bidirectional checkbox
- Encrypted checkbox
- Public Network checkbox
and other components have a different set of properties that are appropriate to the component type.
Out of scope elements
Processes, data stores, actors and data flows can be marked as out of scope. You can use this for elements that are needed to help a diagram make sense, but for which you are not interested in creating threats. To help reviewers (and as a reminder for future-you) you can specify a reason why elements have been marked out of scope.
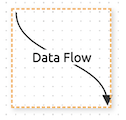
Out of scope elements are indicated in diagrams with dashed lines:
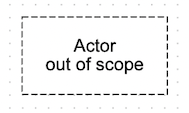
Threat generation is disabled for elements that are out of scope.
Elements with open threats
Processes, data stores, actors and data flows that have open (unmitigated) threats are highlighted in red so that you know where to focus your attention:
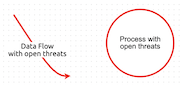
Note that threat boundary boxes and curves can not have threats associated with them.
Editing toolbar

The toolbar on the diagram editing page supports some general diagramming features:
- Delete the selected element(s)
- Configure the keyboard shortcuts from the defaults
- Undo and Redo edits
- Zoom In and Zoom Out
- Toggle gridlines on/off, allowing for neater models
- Close the diagram and return to the threat model details view
- Save the threat model
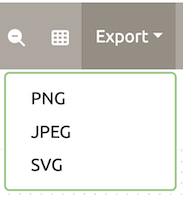
The toolbar can be used to export the diagram in either SVG or PNG image file formats.
Threat Dragon: making threat modeling less threatening